Maine DOT
Accident
Data
Stevens Avenue Project: The MDOT Accident data.
The Maine Dept. of Transportation Accident Records Division compiles traffic data and accident records from all over the state. They are required to do so by federal law.
All the roads in Maine are broken into different "sections". Where the sections meet "nodal points" are set along the road. The detail is amazing. If you are looking for information on a specific section of road, you can ask MDOT for what you want, based upon the nodal points.
That's what I did: I asked for the Accident and Injury Summaries for Stevens Avenue between Ludlow St. and Forest Avenue, essentially the speed hump zone.
FIRST: An explanation of what you are looking at : (click on images for larger views)
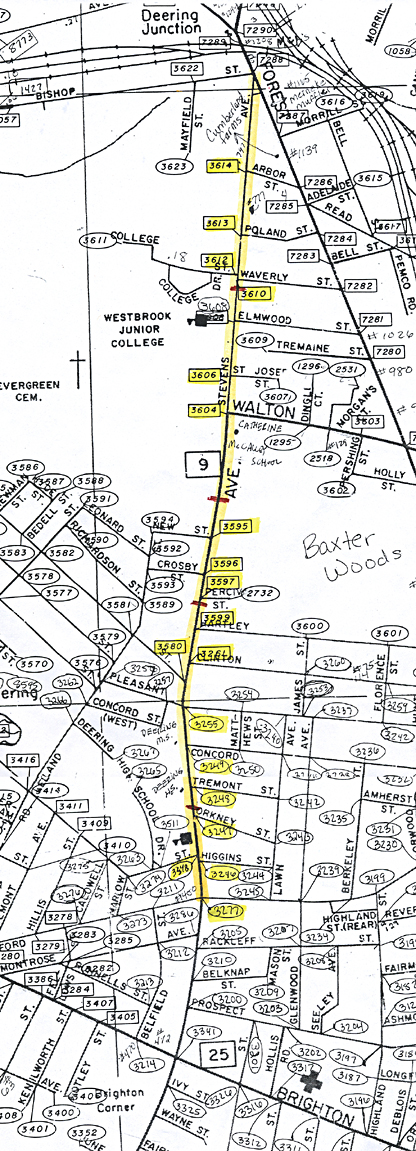 Nodal points:
Left, roads are broken
into sections, and where the sections meet, there are nodal points. This
allows one to really pin down the location of a problem. In this
map from MDOT
(fullsize), Stevens
is denoted in yellow, with the nodes like-wise. E.G : The
intersection of Concord and
Stevens is Node 3244. New and Stevens is 3595
Nodal points:
Left, roads are broken
into sections, and where the sections meet, there are nodal points. This
allows one to really pin down the location of a problem. In this
map from MDOT
(fullsize), Stevens
is denoted in yellow, with the nodes like-wise. E.G : The
intersection of Concord and
Stevens is Node 3244. New and Stevens is 3595
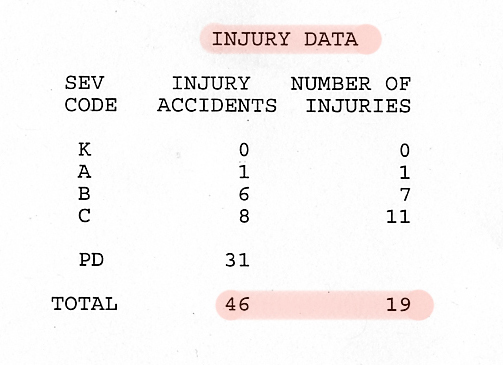
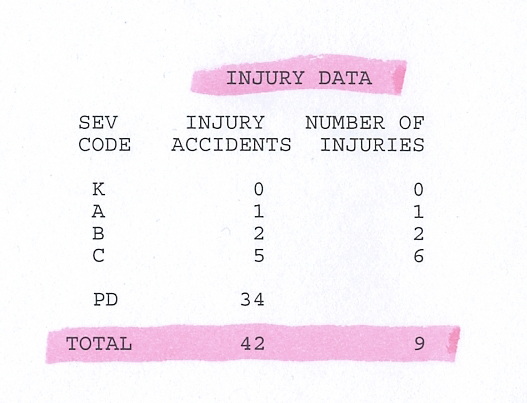
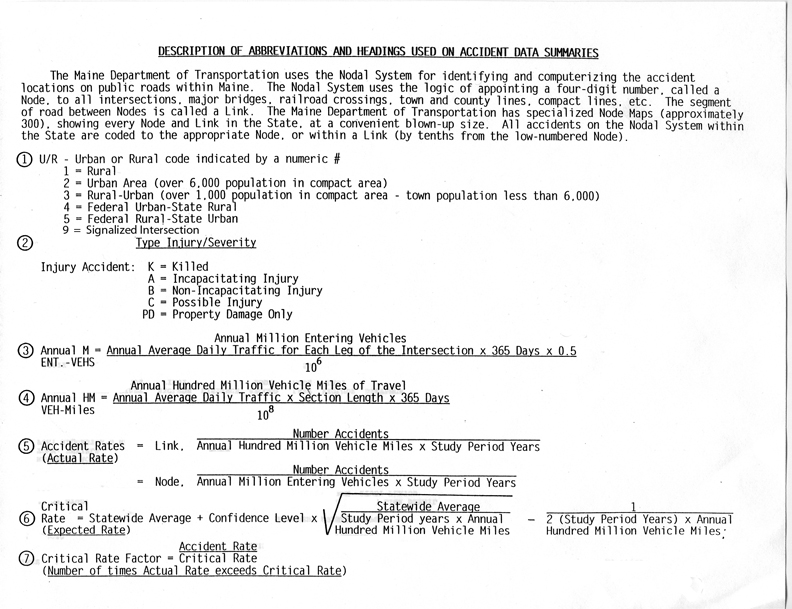 Abbreviations and Headings :
need a little explanation. Of
importance are the letter designators for accident injuries - K,A,B,C,
and PD. An "A" means taken away by ambulance.
Abbreviations and Headings :
need a little explanation. Of
importance are the letter designators for accident injuries - K,A,B,C,
and PD. An "A" means taken away by ambulance.
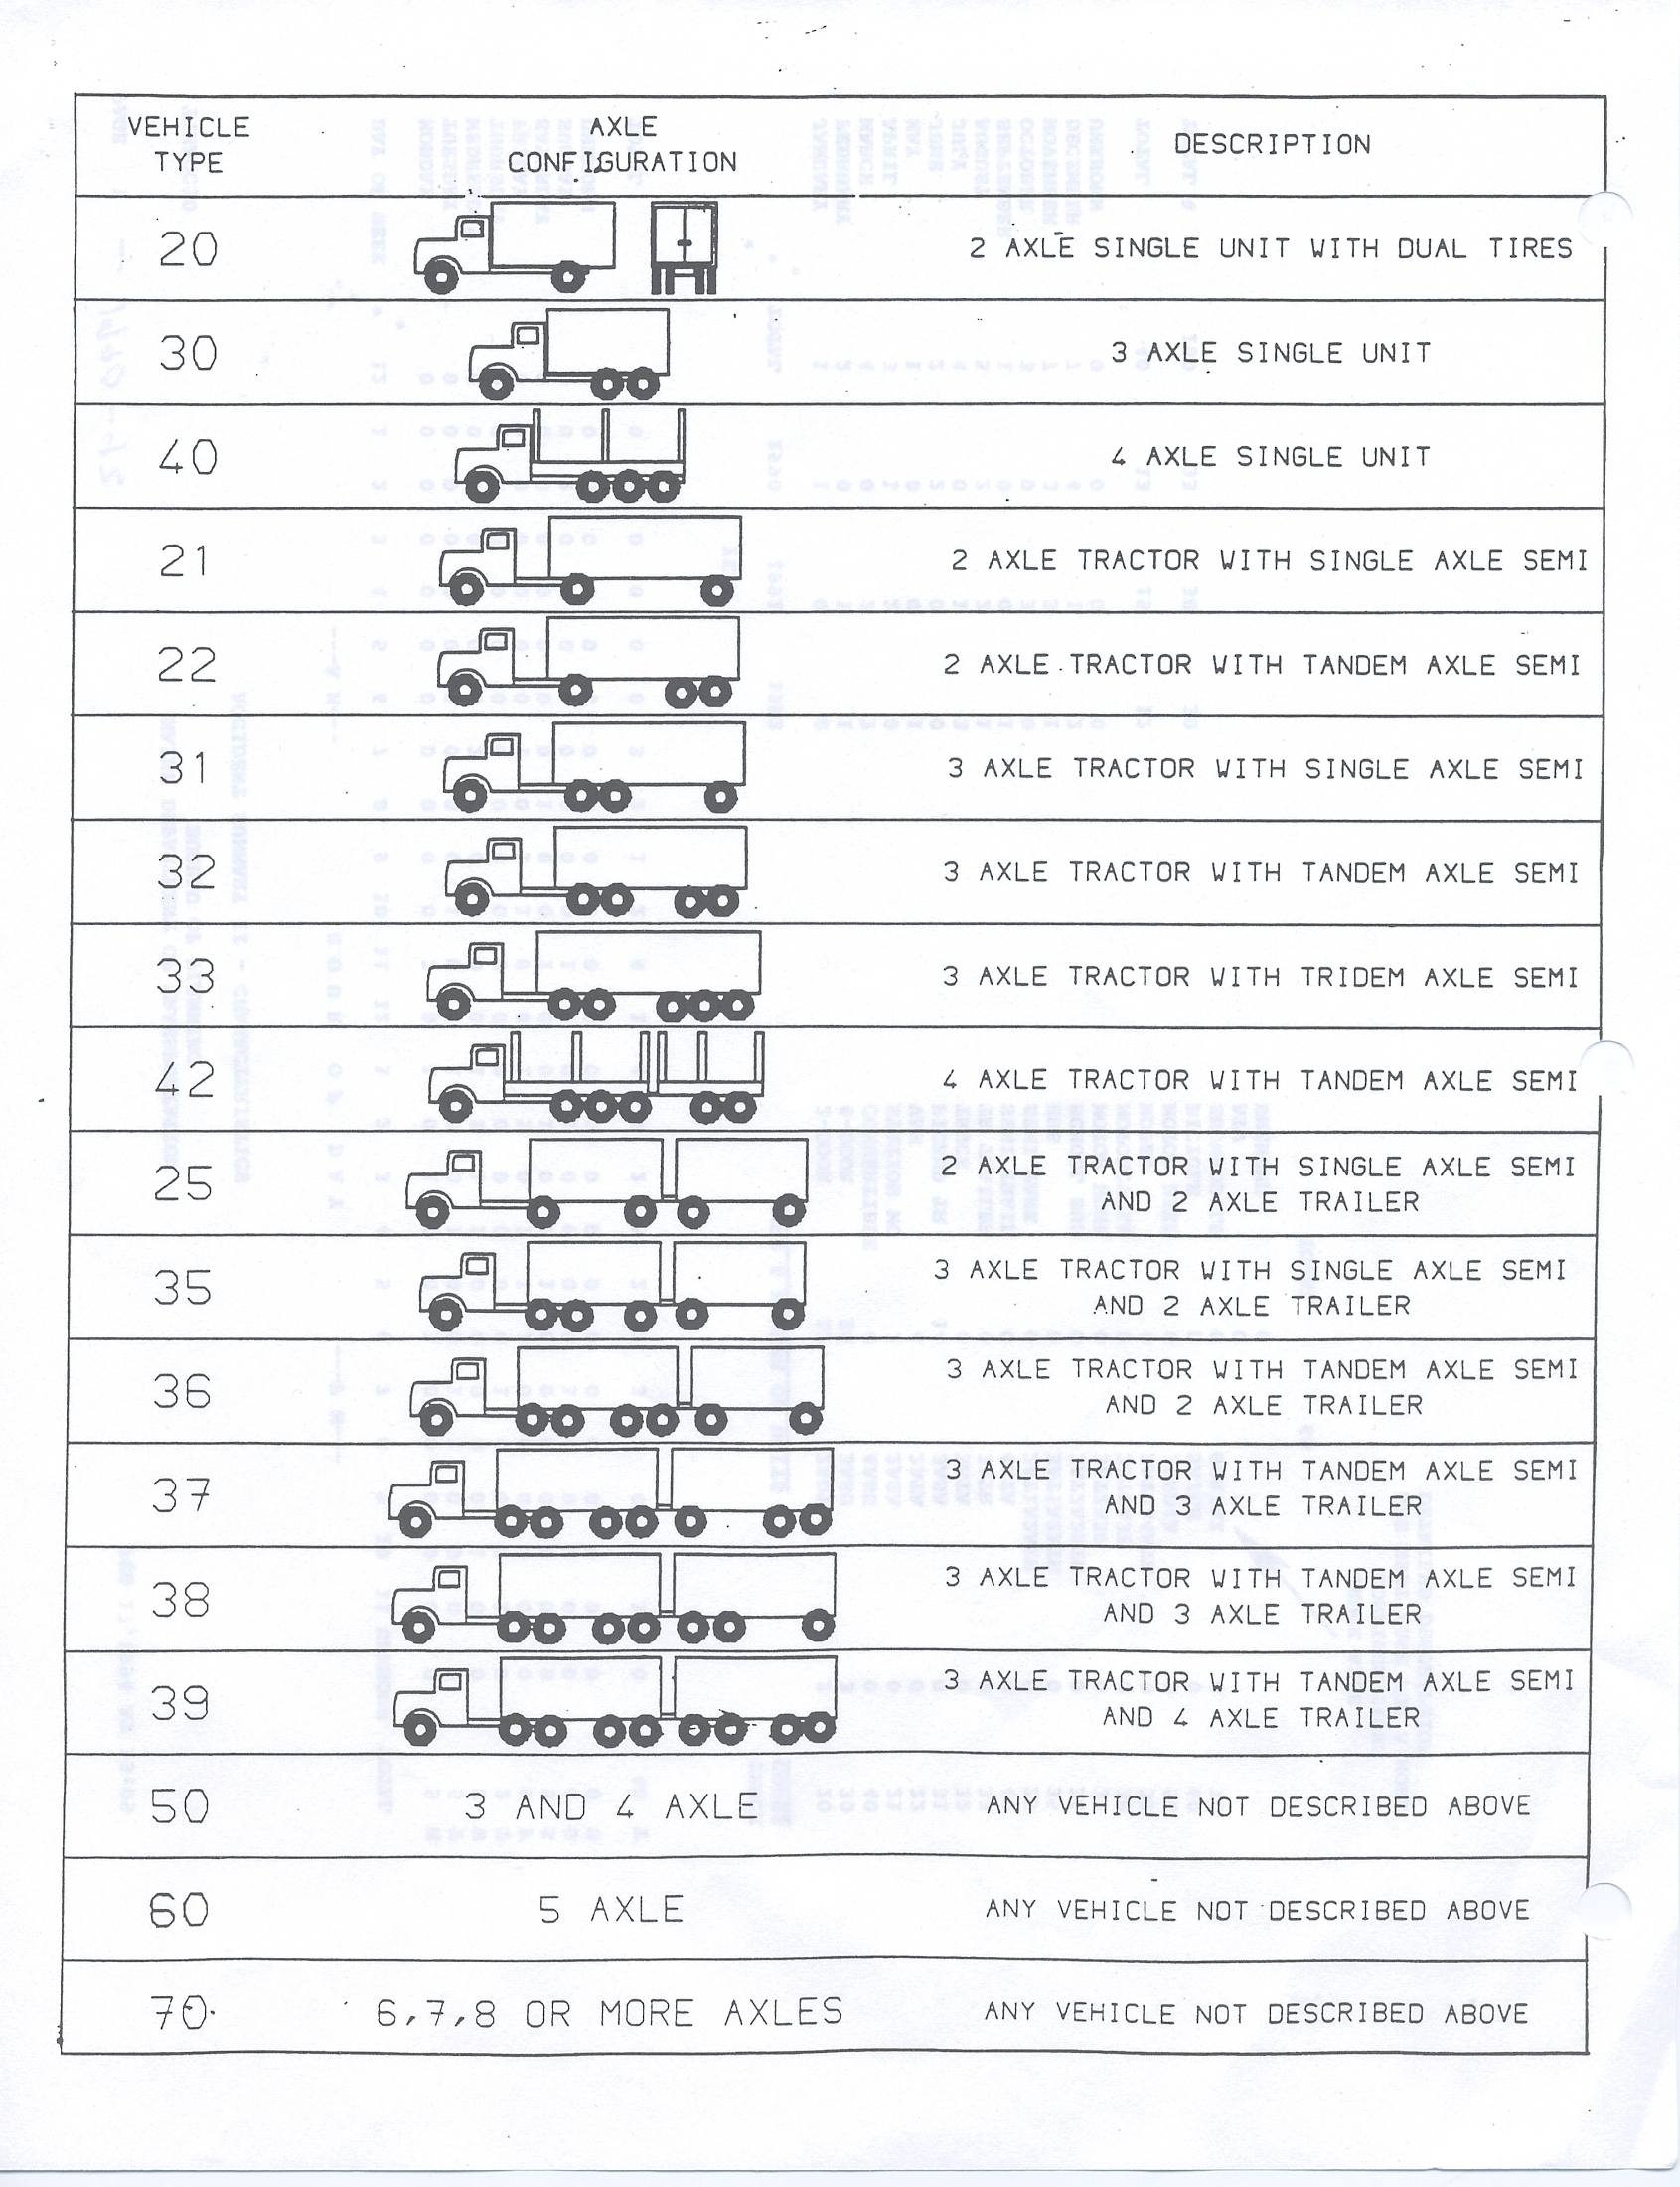
The Vehicle type description list is pretty self explanatory, though you don't see most of those trucks on Stevens.
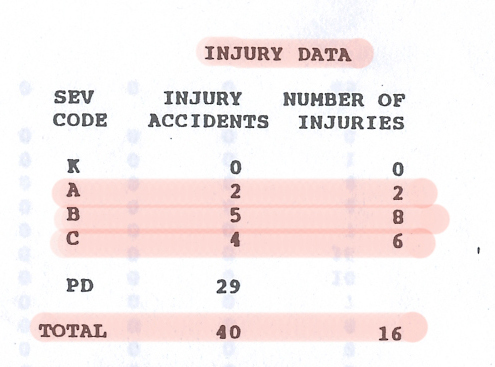
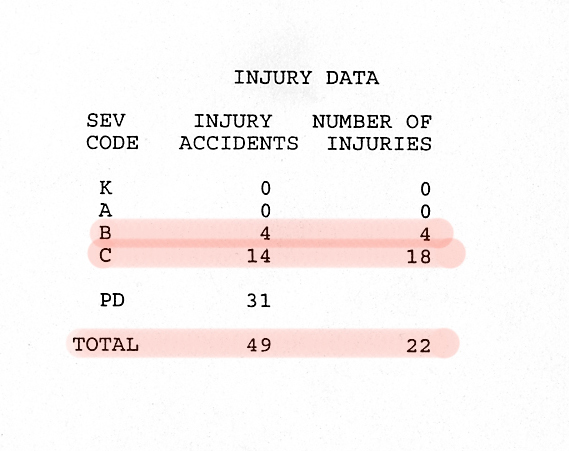
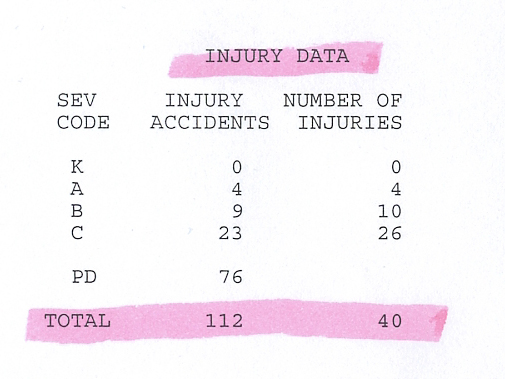
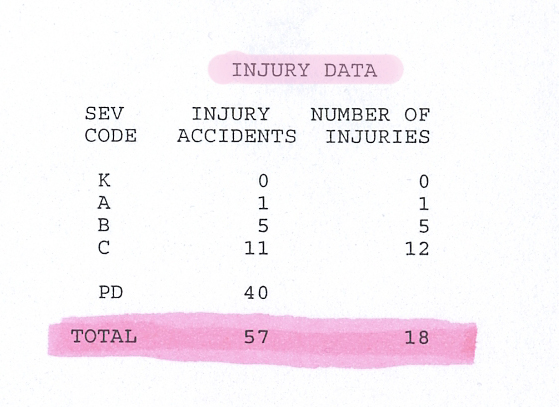
The Accident pages: these are charts of
how many vehicles were involved in what type of incident. It's pretty
clear, and there is lots of detail. Start at page 1, and go to the end.
These are PDF files.
| 1990-92 | 1995 | 1996 | 1997-98 | 1998 only | 1999 |
Looking at the injury statistics, one can see that they took a jump upwards in 1997 after the project went in. The accident rate increased about 58%, considering that 2,400 fewer cars were using the road every day. The "serious injury rate" increased 300% .
| 1990-1992 | 1995 | 1996 |
 |
 |
 |
| 1997-1998 | 1998 | 1999 |
 |
 |
 |
Strange outcome for a "Safety Project", isn't it?
The question is, "So who is safer?"
The answer, of course, is that no-one is safer. Everyone is more at risk. The pedestrians because nothing has changed, but they think it has, so they are perhaps more complacent about the dangers out in the street.
The drivers are more at risk because they have a greater chance of getting hit from behind, or hitting someone else.
The environmental degradation is deplorable too, especially in this era of global warming concerns. 400 tons a year, minimum. Nice.
And last , but not least by any means, are
the hapless citizens in their homes, unaware that the
emergency services they
depend upon so much are now being delayed 1-2 minutes because of the project.
For this, go to Safety Considerations