Stevens Avenue Project : Air Quality
The Air Models
It's a common misconception that slowing traffic down makes the air
cleaner. What actually happens is that the air gets a lot dirtier, because cars
are less efficient at slow speeds. Consider Los Angeles - if things got cleaner
at slow speeds, there would be less pollution out there, and we know that isn't
the case.
There are many
references to this problem in EPA data, which caused me to wonder just how much
pollution the SAP was creating.
To find out,
in the Fall of 1997 I contacted Ronald Severance in the
Air Bureau at the Maine Dept. of Environmental Protection in Augusta.
He was very forthcoming
with information and was sure that there would be an increase in pollution at
slower speeds. He offered to run an "air model", a computer-generated air
quality index that would show the output variations of Volatile Organic
Compounds (VOCs) and Nitrogen Oxide (NOX) against increased or
decreased speed.
VOCs and NOX are the major components of smog. Smog and ozone are why we were under EPA mandate to clean up our air at the time.
The air model showed that slowing traffic
to 20 MPH or below doubles the pollution by the time 11 MPH is reached. The
NOX stays about the same through most of the speed range, varying 2/10ths of 1%
between 11 MPH and 55 MPH.
A very large
number of people go VERY slowly over the humps, as the skid marks by the humps
testify. People are having to slam on their brakes to avoid collisions with
drivers creeping over the humps. It should be remembered that driver
inattention is the greatest cause of accidents on the street.
These figures do not
take into account the effects of braking and acceleration at the humps, and the
even larger amounts generated in cold weather climates when vehicles are warming
up, as in the winter.
Estimates of 10-15 times more pollution generation have been given from
other sources.
Right after I spoke to him the Federal Highway Administration conducted their investigation into just how the SAP was funded and who had approved it. It turned out that the SAP had been inadvertently approved by Mr. Severance. He thereafter became much more circumspect in his replies to me about the project.
Here is Mr. Severance's original letter to me, with the air models following:
________________________________________________________________________________________________
 STATE OF MAINE
Department of Environmental Protection
November 5, 1997
Brian Peterson
229 Prospect St
Portland, ME 04103
Dear Mr. Peterson:
This letter is in response to the questions you posed in your letter dated October 15 concerning the Stevens Avenue "traffic calming" project.
At your request we have run the emission factors (grams per mile) versus speed of a vehicle (miles per hour) for two pollutants: nitrogen oxides (NOX) and volatile organic compounds (VOCs). In addition I have provided two runs: summer and winter as emissions can vary depending on temperature. NOX and VOCs are the primary pollutant precursors in the formation of ground-level ozone.
As I stated on our phone call, in general NOX increase with speed and VOCs
decrease with speed. You can see from the attached graphs that this holds true.
Looking at the summer graph, the optimum speed to minimize VOCs appears to be
about 55 mph and the optimum speed to minimize NOX appears to be about 20 mph.
The optimum speed to minimize both pollutants would be the point
where the two curves intersect. This speed appears to be about
25 mph.
Therefore, the statement of air quality benefits from reducing
the speed of vehicles on Stevens Avenue from 34 mph to 25 mph appears to be true
when addressing both pollutants.
This analysis does not consider the emission impacts of increased braking and acceleration nor does it consider any reduced trips that may occur because of increased pedestrians or bicycling.
Although the Department is no longer on the CMAQ project evaluation team, a review of our CMAQ file shows that the Department was on the evaluation team that reviewed and approved the proposed Stevens Avenue project. The air quality analysis conducted on the proposal was deemed adequate and conducted using the best available information.
I hope this information will alleviate your concerns on the air quality benefits associated with the Stevens Avenue project.
If you have any questions on the analysis feel free to give me a call at 287-7039.
Sincerely;
![]()
Ron Severance
Bureau of Air Quality
CC. Dean Lessard, DOT
James Brooks, DEP BAQ
____________________________________________________________________________________________________________________________
click on images for larger view, annotated
 |
 |
| Summer air model | Winter air model |
The above graphs were included in the final reports supporting the SAP, for some reason. To me, they directly indicate that there is going to be more pollution at slower speeds, which indicted the SAP. This would suggest that it not be built, or be removed if constructed. Considering that "slowing traffic down to clean up the air" was the stated goal of the project, how can the City use these graphs to support their position, as the graphs directly contradict it? (Probably the same way they use everything else - they ignore their own findings.)
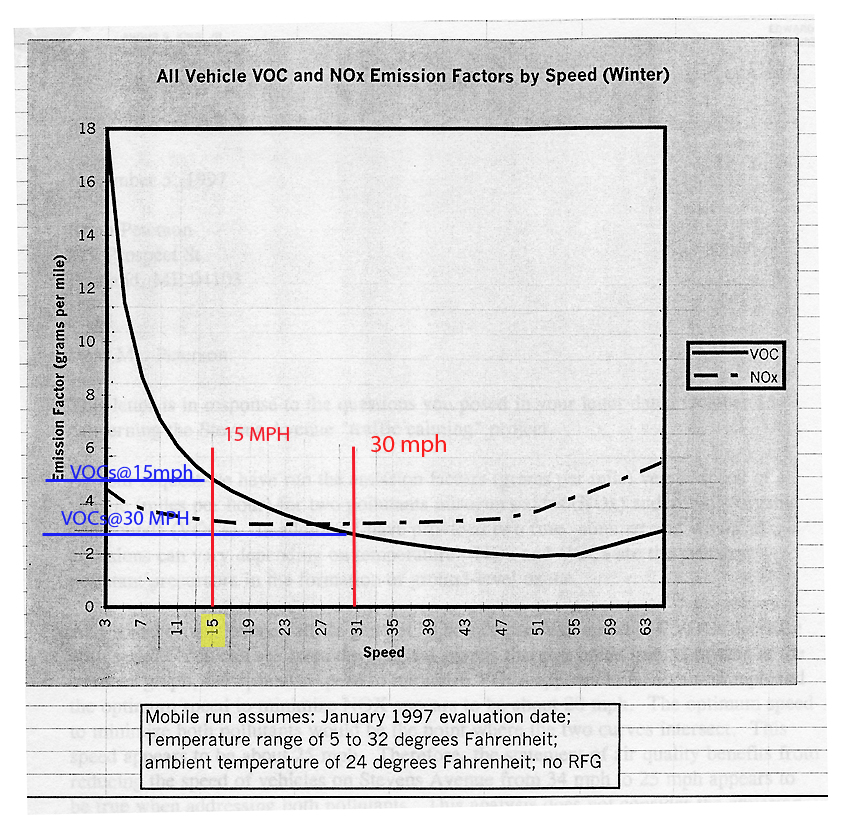
The winter model much more pollution than the summer one at slow speeds. Supposedly the "most efficient" speed is where the lines cross.
I wasn't really interested in the "most efficient" speed, I wanted to know where or how the least pollution was generated. As you can see, it's at about 55 MPH, which is obviously too fast for traveling Stevens Avenue!
Notice that in both graphs, the pollution output at 15 MPH, the stated goal of project supporters, is almost double that of 30 MPH.
Remember, this model is based upon a steady rate through the hump project. Like Mr. Severance says: "This analysis does not consider the emission impacts of increased braking and acceleration" , something that occurs all the time at speed table installations, so we know that the air quality is less than stated.
In real life, people often slow down, down, down, when they get to the humps, then speed up once across. They do not travel at a steady rate. All of this braking and acceleration is what really drives the VOCs and NOX up, up, up, to the point where there is 10-15 TIMES the air pollution being generated now then existed before the projects installation.
Pretty strange for an air quality project.
What is also strange that our local officials allegedly didn't know that this would happen, considering that they are the self-proclaimed experts about this type of thing. Or maybe they did know, and didn't care.
Mr. Severance states that: "The air quality analysis conducted on the proposal was deemed adequate and conducted using the best available information.", which is not true. Massive amounts of air quality improvement data have been developed in the years since the bogus Australian report ("Winning Back the Cities") used to support the project had been written in the early 1980s. It's been shown to be flat-out wrong.
Next : AIR QUALITY FUNDING & CMAQ