SAP
Speeding and Accidents -
Vehicle
Accidents
Stevens Avenue Project :
Speeding and Accidents 1993
VEHICLE ACCIDENTS
1993 Stevens Avenue Pedestrian Study Phase I --Data Collection and
Problem Identification Report is here.
1998 PACTS Phase I Report Final Monitoring Report is here.
1998 Phase I Final Technical Supplement Appendix III Accident data is here.
click for larger image
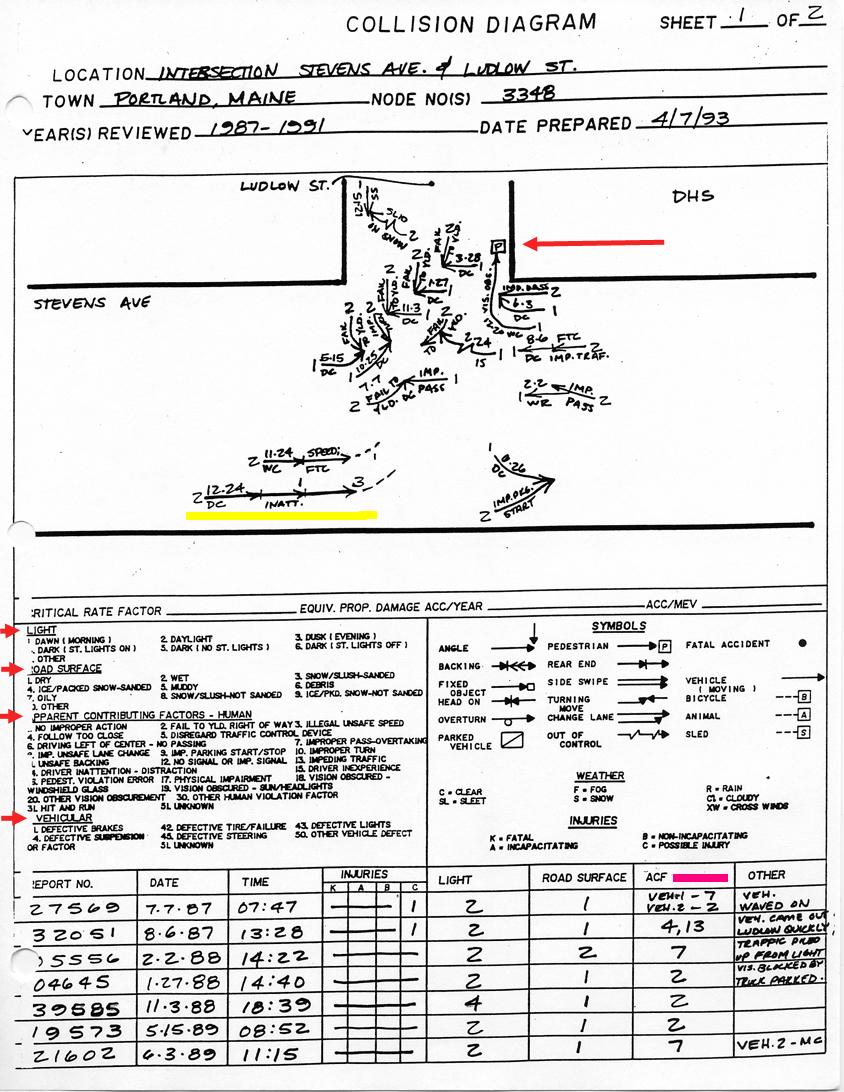
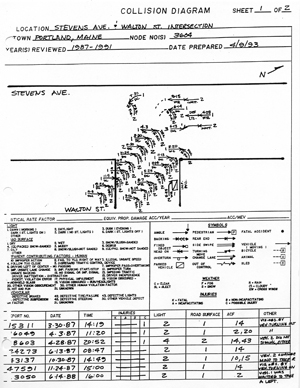
| EXPLANATION: At right is a collision
diagram used by the 1993 Phase I Report writers to portray
the vehicle accidents that occurred at Ludlow and Stevens
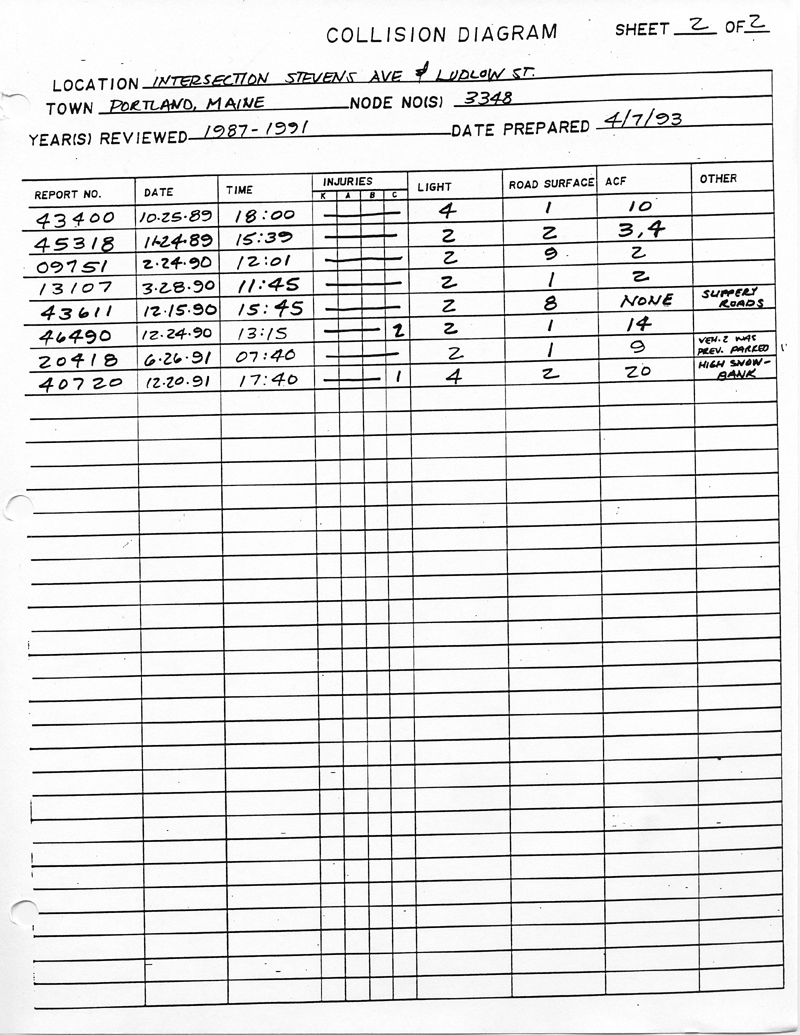
between 1987-1991. The long red arrow is pointing to the lone pedestrian accident, explained on the previous page (here). The short red arrows to the upper left bottom refer to the "conditions" block in the lower right. To explain the data: Look at the first accident diagram on the bottom of the diagram block, over the yellow line. We can see Dec. 24, 1990, there was a 3-car accident where car #3 was making a left turn, whereupon it was struck by car # 1, which was hit by car # 2. It was daytime, and the road was dry. In the "ACF" column, the "additional contributing factor" was driver inattention, comparing the ACF number to the chart at left. This is denoted in the second page of the list. There were four accident areas officially presented as evidence of a speeding-accident problem on Stevens. Note that none of these are in the Longfellow School Zone and that once again, speeding is not the problem! Click on image for PDF file on each: |
 |
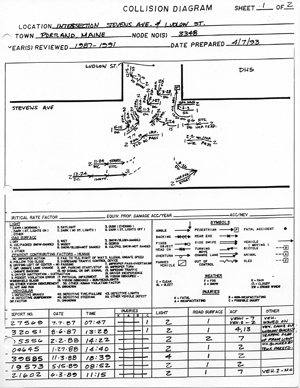
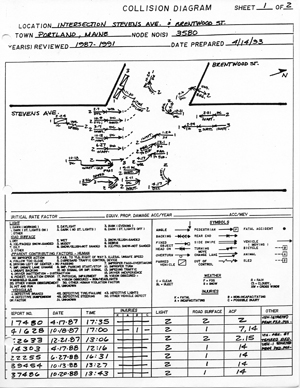
| Stevens and Ludlow 1987-91 | Stevens and Brentwood /> 1987-91 | Stevens and Walton 1987-91 |
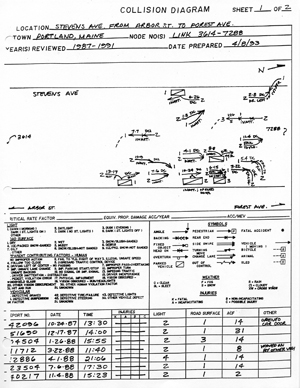
Stevens Avenue Arbor St to Forest Ave. 1987-91 |
 |
 |
 |
 |
|
Speed is a contributing factor in just 2 accidents presented in
the above: The first at Stevens and Ludlow, accident # 45318,
where a rear-end accident occurred on the wet road . "Following
too close" was another factor in that one. The second at Stevens and Brentwood, accident 09456, where an ambulance was rear-ended on an icy road by a driver not paying attention. Note that no mention is made of "speeding" (exceeding the speed limit), just that speed was a "factor". The drivers could have been doing 5 mph, on a slippery road. More of this type of thing is seen in the 1998 Final Monitoring Test |
|||
|
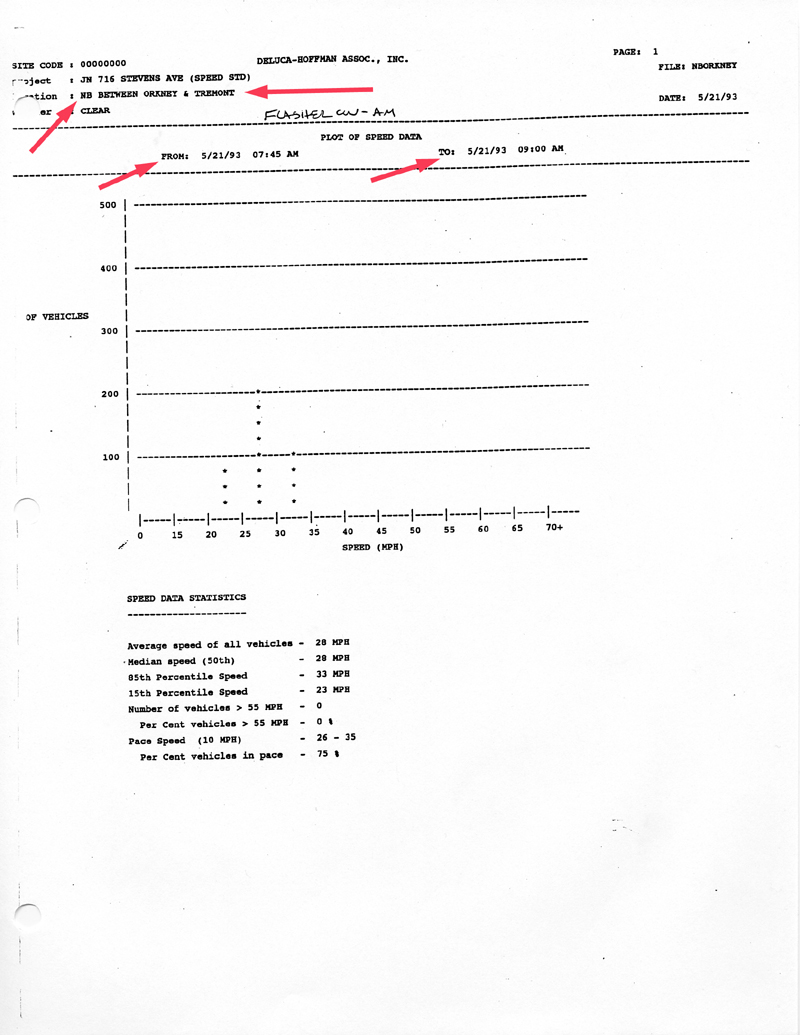
Speed
tests were done in 1993, which showed an average speed of 28mph.
That specific speed was measured
between Orkney and Tremont where cars are
slowing down entering the school zone,
275 feet away from the Longfellow
crosswalk. It was then somehow “moved” to in front of the school
by the supporters to
make things seem bad and fast. This speed graph is a representative page of the graphs from the Phase I Pedestrian study Technical Supplement: Appendix E. The red arrows are pointing out the location of the speed test (between Tremont and Orkney) and the time (730am - 300pm). The graph gives the number of cars - 25 per * The data block gives the totals. |
 |
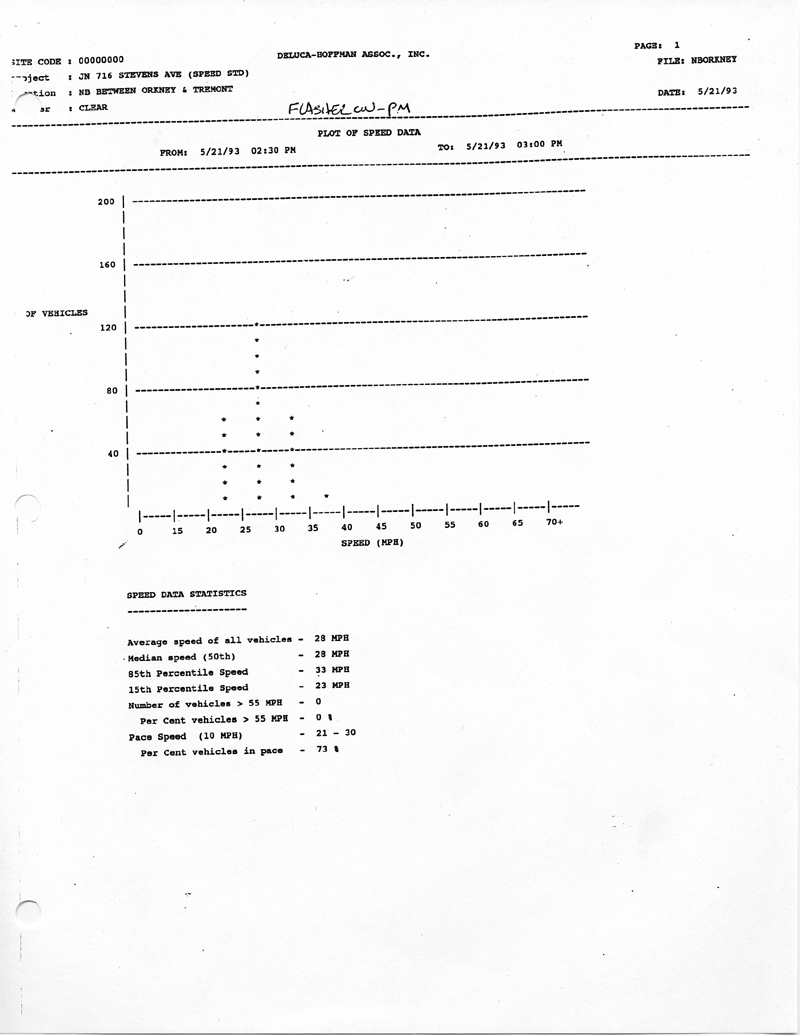
| This next was
very well done: looks scary! This was measured between 2:30pm and 3:00pm still 275 feet from the Longfellow crosswalk during the exact period when there were the least number of high school students on the street (probably none), and NO grade school students or crossing guard visible. Looks bad though doesn't it? Dangerous! It's not. Deering HS gets out at 200pm. It's a pigpile. There are kids everywhere in the street, and cars are mostly stopped. You are not going to be able to speed. The kids are gone by 215pm. It's high school...... Longfellow School gets out at 300pm. Once again, the cars stack up, because drivers can see the kids, there is a crossing guard at the crosswalk, and there are a lot of parents in cars picking their kids up, if not walking them. You are not speeding. You are creeping. |
 |
Because of the confluence of the signal light at Stevens and Pleasant, and the crossing guard in front of the school, when school children are in front of the schools traffic may be able to get up to 15 MPH if it’s lucky. 5-10 MPH, just where it should be, is more likely.
The crossing guard didn't have 4 complaints lodged against him in 1997 by the drivers of the busses he was slowing down, for nothing. They were running late.
DPW head William Bray stated to the Portland Press Herald that accidents had decreased after the speed tables were installed.
He stopped saying that after I told him that according to Maine DOT there were 35 accidents prior to the hump installation and 59 afterwards, which didn't seem like a "decrease" somehow. It's a 58% increase according to the FHWA.
Speeding and Accidents 1998
Top